
Intelligent Reporting for Better Decisions
By Rahul Saxena, Chief Analytics Office of FrogData, [email protected]
& Tej Soni, CEO of FrogData, [email protected]
It’s advice that’s been around for centuries and still makes sense: look before you leap. As a business owner or manager, you want to ensure you have all the information needed to make a decision before making it.
During the pre-computer days, however, decision-making in a dealership relied mostly on instinct, gut, memory and scraps of paper. Not exactly the best combination for dealing with today’s fast-moving market and knowledgeable consumers.
Fortunately, we now have the capability to look at data and get intelligent reporting that can help us make better decisions.
Are You Missing Your Data’s Value?
Dealerships have made huge investments in computer solutions: DMS, CRM, service appointment and management, websites, online marketing, etc. Each of these investments generates vast amounts of data, which when analyzed correctly can produce great business insights. Businesses that use data to make decisions are four times more likely to be more profitable.
Dealers collect huge reservoirs of data. Which begs the question: are dealers able to distill that body of data into meaningful, actionable responses? The answer is yes, with a little assistance from a good reporting platform. To help you better understand the decision-making potential behind the data you collect, here’s a quick primer on reporting basics.
Tables
The fundamental reporting format is a table, and most systems will generate useful tabular reports. For instance, look at your favorite report in your DMS or CRM and you’ll see the data is represented in an Excel-type format.
Although tables are simple and easy to create, they can be deceptively hard to understand. Most users will instinctively look at the familiar parts of a report — such as the expense column or the last cell to see if they’ve made a profit or loss. These quick glances are an injustice. The entire point of the report, the big picture, if you will, with all its beautiful data is lost and goes unappreciated.
Static Graphs
Data reporting today has moved beyond just tables. First came static graphs. Then a wave of animated graphs, interactive graphs, dashboards, data exploration systems and decision support systems. The graphical depiction of data is loosely called data visualization. This representation has become the most important format for reporting, because it allows the user to understand the movement of data over time and across categories.
Tabular reports have been around for a longer time than graphs. Some people accustomed to reading data in table format haven’t trained themselves to read graphs. This restricts their consumption of information. Because tables must be read by row and column, you’re most likely comparing two numbers in the table or one from memory and another in the table. In business, however, you need to think of many things together. Sales performance, for example, is measured in both units and profits, across salespersons and months, new and used.
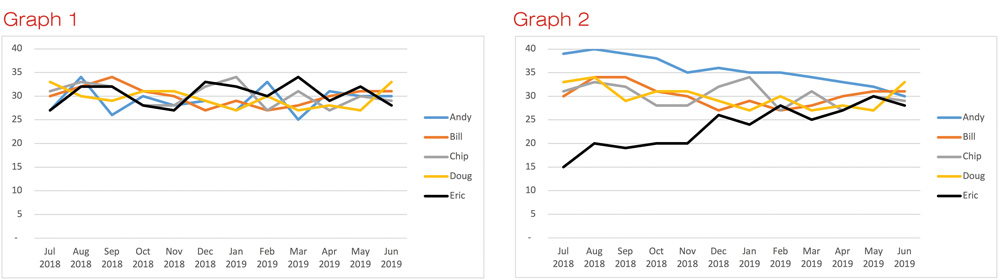
Graphs deal with this complexity to reveal the patterns in the data. For example, Graph 1 and Graph 2 both have the same annual results. Graph 1 shows that the people have similar performances. Graph 2 lets you quickly see that Eric is improving while Andy is losing ground. What’s easy to see in a graph gets hidden in tables.
Interactive Graphs
Interactive graphs enable us to zoom in and select or remove data. You work with the graph and it filters the data and changes the graph, so one interactive graph can replace many static graphs. Crucially, they help us retain the context, because the zooming and filtering is done after you see the big picture. Interactive graphs work well when you’re on your PC or tablet.
Dashboards
Dashboards help organizations use multiple reports. Instead of several reports or spreadsheets, you can use a single online dashboard system. Automation of dashboards can eliminate the time spent in hand-building reports repetitively. Getting reports from the dashboard eliminates the confusion from conflicting hand-built reports.
Explore, Inform & Decide
We propose you organize your reports by what they provide:
1. Explore: Microsoft Excel and similar tools let you make your own data-driven reports.
2. Inform: Use pre-built reports with tables, graphs and commentary.
3. Decide: Provide decision-makers with the reports needed to make a decision.
You no longer need to feel lost in a world of data. Learning how to use graphs to understand data will show you the way forward. Think of those reports as your data’s GPS. If you listen carefully, those reports will tell you where to go next.
It’s not about whether you can afford management reports, but whether you can afford to make decisions without them. With timely reports as your guide, decision-making has never been easier or more reliable.