By Tim Englehart, Vice President, Automotive at InMoment
Great customer experiences certainly enhance brand image and loyalty, but does going that extra mile to deliver top-of-the-line customer service really translate into additional sales and revenue at the dealer level?
The short answer is yes.
We recently accepted a challenge to uncover the true, monetary value of providing an excellent dealership experience.
The short answer is $147,348.
That’s the annual average revenue increase a dealership can expect to realize by raising its customer satisfaction score by a single point. Let’s take a quick look at the science behind those numbers.
The Dealership Loyalty Study
The Respondents:
Our 2021 Dealership Loyalty Study comprises survey responses from 12,962 individuals who opted in and met two criteria. First, they purchased a new car in 2013 or 2014, and secondly, they participated in the 2013 or 2014 New Vehicle Customer Study (NVCS). The NVCS is a syndicated, subscription-based industry survey administered to new car buyers. It measures choice, experience and loyalty related to their purchase.
Of the 12,962 Dealership Loyalty Study respondents, 4,757 (37%) reported that they replaced their 2013/2014 vehicle with another new vehicle. This data set was used to conduct the sales-to-sales loyalty analysis presented below. The data set was weighted to properly represent the 2013 and 2014 distributions of vehicle model market share.
Customers rated their dealership experience while purchasing their 2013 or 2014 vehicle in the original NVCS survey. The 2021 Dealership Loyalty survey then asked these customers about the service performed on their 2013/2014 vehicle, whether they replaced their vehicle, and if so, where they bought their replacement vehicle. Finally, the survey asked which replacement make/model these customers purchased.
Sales-to-Sales Loyalty
Loyalty rates were calculated for different levels of customer experience, providing a
closer look at the relationship between customer experience and dealership loyalty.
Two measures were used:
1. Satisfaction with the initial dealership purchase experience (Dealership Sales
Satisfaction) as measured on the 2013 or 2014 NVCS survey
2. Overall Dealership Satisfaction as measured on the 2021 Dealership Loyalty survey.
These results are shown in the chart below:
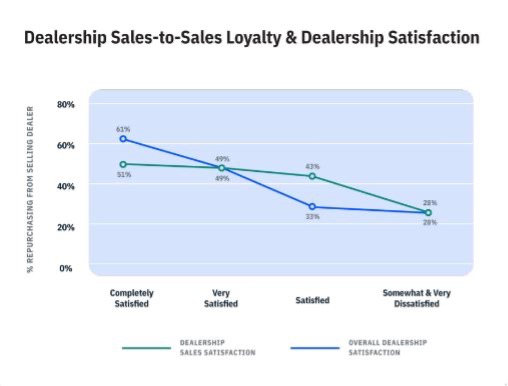
The chart demonstrates that dealership loyalty rates fall abruptly as satisfaction with the dealership decreases. Customers with the highest levels of satisfaction were about twice as likely to repurchase from their original dealership than those with the lowest levels of satisfaction. This holds true for both satisfaction as measured at the time of purchase (Dealership Sales Satisfaction) and satisfaction measured over the vehicle’s lifespan (Overall Dealership Satisfaction).
A Financial Model: Ownership Period, Dealership Satisfaction, Repurchase Loyalty and Sales Revenue
Models were created that estimate the impact of an average dealership’s sales loyalty due to an increase or decrease in customers’ satisfaction scores by one level (e.g., people moving from “Very Satisfied” to “Completely Satisfied” and so on). These models enabled us to estimate the financial impact customer satisfaction has on dealerships solely due to its relationship with sales loyalty.
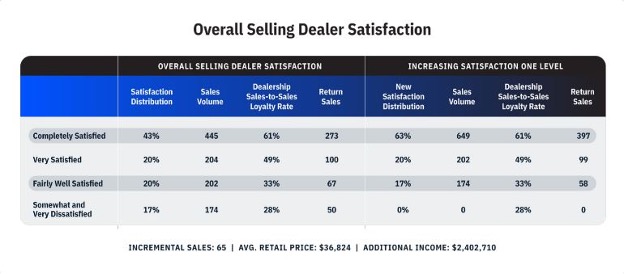
To estimate the impact of customer satisfaction on sales revenues, we used the following NADA dealership statistics:
- Average annual number of retail units sold: 1,026
- Average vehicle retail selling price: $36,824
The model below tells a compelling story. More satisfied customers are much more likely to return to their selling dealership when replacing their vehicle than less satisfied customers. Therefore, according to the data, a dealership can realize over $2.4 million per year in additional sales revenue by increasing customers’ satisfaction by just one level over their vehicles’ lifespan.
Perhaps more importantly, conducting the same analysis but allowing satisfaction to drop one level represents a decrease in dealership sales revenue of over $3.5 million.
How Much is One Point of Satisfaction Worth?
Of course, the answer to this question depends on the scale being used. Customer experience scales in the automotive industry vary from 1,000 points (most JD Power scales), 200 points (NPSTM scales ranging from +100 to -100), 100 points (many typical proprietary customer experience scales), 10 points and 5 points. To answer the “how much is one point worth?” question, we used a 100-point scale by assigning scores of 100, 75, 50, 25 and 0 to each point (respectively) on our Completely Satisfied to Very Dissatisfied 5-point scale.
The typical dealers’ customer experience score could be computed on a 100-point scale given the satisfaction distribution. For instance, the customer experience score for the 2021 satisfaction distribution shown below is 70.1 because (.43 x 100) + (.20 x 75) + (.20 x 50) + (.17 x 12.5) = 70.1.
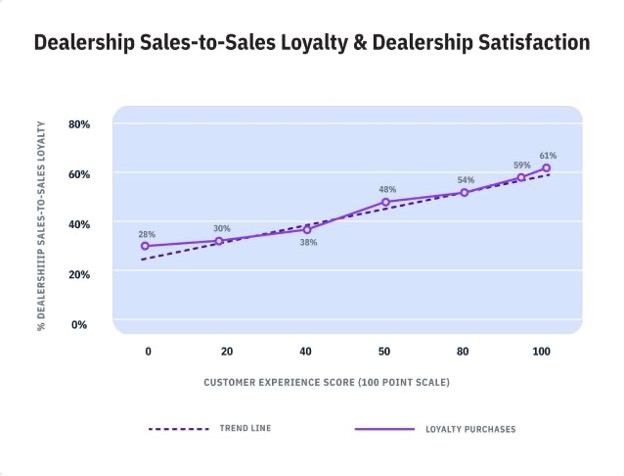
Next, the model exercise was continued by raising customers’ satisfaction scores one level until all customers were completely satisfied, and lowering customers’ scores one level until all customers were very dissatisfied. For each of the seven steps in this process, we calculated both the resultant customer experience score and the percentage of returning customers. These points are shown below (along with the trend line that shows the nearest linear approximation of the relationship):
Finally, using the trend line equation shown, loyalty percentages were calculated for each point on the 100-point scale. Revenue associated with that level of loyalty is based on the typical 1026-unit dealer selling vehicles at an average price of $36,824.
The revenue difference between all points was equal and came out to $147,348 given the linear trend line used. In reality, however, the relationship is steeper over the higher parts of the scale (meaning the revenue associated with each point is larger), and the relationship flattens out over the lower points of the scale.
Conclusion
This study provides a rough approximation of how much customer satisfaction is worth to dealerships in terms of relationship and sale-to-sale loyalty. However, this approximation isn’t entirely accurate because the model does not take factors like customer referral behavior, dealership brand image, and whether customers use the dealership for service work into consideration. This means that this entire analysis likely represents only the tip of the iceberg when it comes to the relationship between customer experience at the dealership and dealerships’ ultimate revenues.